Dev frameworks
How to Fix Puppeteer Memory Leaks in Production (and When to Stop Running Chromium)
July 21, 2026 · 9 min read · Grabbit Team
If you run Puppeteer in production long enough, you eventually meet the same graph: resident memory climbing steadily over hours, flat under test, until a container hits its limit and the OOM killer takes it. The short version is that Puppeteer memory leaks in production are almost never a single bug. They are three problems stacked on top of each other, and the fix is a combination of hygiene, bounding, and an honest question about whether you should be running Chromium at all.
This post covers all three: what actually leaks, the fixes people ship (and keep shipping), how to find the real source instead of guessing, and the case for handing the whole thing off when your only job is a screenshot.
The short answer
- Close everything. Every
pageandBrowserContextyou open must be closed in afinallyblock, on every path including timeouts and throws. Leaked pages are leaked renderer processes. - Treat Chromium as disposable. A long-lived browser accumulates state it never fully releases. Recycle it after a fixed number of jobs instead of keeping one alive forever.
- Bound the blast radius. Cap concurrency, launch with
--disable-dev-shm-usage, and set a memory ceiling so one bad page cannot take the box down. - Reap zombies. Run under an init process (
--init/tini) and force-kill on timeout so crashed captures do not leave orphaned Chromium behind. - Then ask if you need Chromium at all. If the deliverable is an image of a URL, a hosted screenshot API removes the fleet, and the memory problem with it.
The rest explains each one.
What actually leaks (it is not your Node heap)
The first mistake is measuring the wrong thing. You watch process.memoryUsage(), see the Node heap sitting calm, and conclude there is no leak. Meanwhile the container's memory keeps climbing. That gap is the whole story: Chromium runs as a tree of child processes, and the memory you are leaking lives in those children, not in your Node process.
Three things compound:
- Unclosed pages and contexts. Every
browser.newPage()andbrowser.createBrowserContext()spins up renderer state. If your handler throws or times out before it closes them, that state stays resident. Do this a few thousand times an hour and the leak is your own code path, not Chromium's. - A single long-lived browser accumulating state. The common "open one browser at startup, reuse it forever" pattern looks efficient and leaks slowly. Across thousands of navigations, Chromium holds onto caches, detached DOM nodes inside pages, and listeners it never fully frees. RSS drifts up even when you are closing pages correctly.
- Zombie processes. A capture that crashes or hangs can leave an orphaned Chromium process the OS still counts against your cgroup. These do not show up in your app metrics at all. They show up as a box that is "out of memory" while your app swears it is using very little.
So the resident-set-size line you watch climb on your dashboard is usually the sum of leaked child processes and orphaned browsers, not a classic heap leak. That changes how you fix it.
Fix 1: close everything, in a finally block
The unglamorous fix that removes most of the leak. Wrap every capture so the page and browser are closed no matter how the function exits, including on a thrown error or a timeout:
async function capture(browser, url) {
  const page = await browser.newPage();
  try {
    await page.goto(url, { waitUntil: 'networkidle2', timeout: 30000 });
    return await page.screenshot({ fullPage: true });
  } finally {
    await page.close(); // runs on success, throw, and timeout alike
  }
}
The finally is the point. A lot of leaking code closes the page on the happy path and skips it whenever goto throws, which is exactly when captures pile up (a slow page, a network blip, a bot wall). Close in finally, and audit every early return and throw above it.
Fix 2: treat the browser as disposable
Even with perfect page hygiene, one browser held open for the life of the process drifts upward. The pattern teams converge on is a pooled browser that gets recycled after a fixed number of jobs:
let browser;
let jobs = 0;
const MAX_JOBS = 200; // recycle before the drift matters

async function getBrowser() {
  if (!browser || jobs >= MAX_JOBS) {
    if (browser) await browser.close();
    browser = await puppeteer.launch({
      args: ['--no-sandbox', '--disable-dev-shm-usage'],
    });
    jobs = 0;
  }
  jobs++;
  return browser;
}
You reuse the browser enough to amortize the several-hundred-millisecond startup cost, then throw it away before accumulated state becomes a problem. A brand-new browser per request is also leak-free but pays that cold start on every capture. Recycling is the middle path, and "disposable Chromium" is the reliability idea, not any single flag.
Fix 3: bound the blast radius
None of the launch flags below fix a leak. They stop one bad page from taking the whole container down:
--disable-dev-shm-usagemakes Chromium use/tmpinstead of the default/dev/shm, which is tiny (often 64MB) in containers and a frequent cause of crashes that turn into zombies.--js-flags="--max-old-space-size=512"caps the V8 heap inside the renderer so a runaway page fails fast instead of eating the box.- Concurrency cap. Never run more parallel captures than the container has RAM for. A simple queue with a fixed worker count beats "spawn a browser per incoming request" every time. Each Chromium instance can easily want a few hundred MB, so on a 1GB container you are looking at a small handful of concurrent captures, not dozens.
Fix 4: reap the zombies
Orphaned Chromium processes are the leak that does not show up in your metrics. Two defenses:
- Run under an init process. In Docker, pass
--init, or usetini/dumb-initas PID 1. Without one, orphaned children are never reaped and accumulate until OOM. - Force-kill on timeout. Wrap the whole capture in an overall timeout that calls
browser.close()(and, if that hangs, kills the process) so a stuck page cannot leave a browser resident forever.
Then watch for them: periodically log ps filtered to chrome so you can see the process count creeping before the OOM killer tells you the hard way.
How to actually find the source
Guessing is slow. Measure in this order:
- Watch RSS and process count, not the Node heap. If total container RSS and the number of
chromeprocesses climb while your Node heap is flat, the leak is unclosed pages, an un-recycled browser, or zombies. That alone narrows it to Fixes 1, 2, and 4. - Diff two heap snapshots under steady load. Take a snapshot of one browser context, run an hour of representative traffic, snapshot again, and diff. Detached DOM nodes and retained listeners that grow between snapshots point at page-level leaks in the site you are capturing (or in an
page.on(...)handler you forgot to remove). - Confirm your
finallyblocks run. Add a counter for pages opened vs. pages closed. If they diverge, you found it before touching a profiler.
The DevTools heap profiler shows an OOM-killed container as "RSS growing over hours" rather than a single spike, which is why time-series RSS plus process count is the diagnostic that actually catches it.
When to stop running Chromium
Here is the honest part. Every fix above is real, and if you need a browser you should ship all of them. But notice what the work is: memory hygiene, process reaping, cold-start tuning, and a 3am pager rotation, all in service of keeping a browser fleet alive.
If the only reason you reached for Puppeteer is to take a screenshot of a URL, that is a lot of infrastructure for a job that is one HTTP request. A hosted screenshot API runs the browser for you and returns a hosted image, so there is no Chromium to launch, no pages to close, no zombies to reap, and no memory graph to watch:
curl -X POST https://grabbit.live/api/v1/grabs \
  -H "Authorization: Bearer sk_live_your_key" \
  -H "Content-Type: application/json" \
  -d '{
    "url": "https://example.com",
    "width": 1280,
    "full_page": true,
    "format": "webp"
  }'
The parameters map to the Puppeteer options you were already setting: width (320 to 1920), height (240 to 1080), full_page for the whole scroll height, format (png, jpeg, or webp), delay_ms (0 to 10000) to wait for late content, and selector to capture a single element. Grabbit is $0.002 per grab. Annual-plan credits reset at renewal rather than monthly, while separately purchased top-up credits do not expire while your account remains active, so you pay for captures rather than browser uptime. The Node.js screenshot guide shows the same request from fetch, and if you are wiring this into an agent, screenshots for AI agents covers that path.
This is not "never use Puppeteer." Keep the library when you click, type, scrape, or run end-to-end tests and genuinely need to drive the browser. For a broader take on that split, see Puppeteer alternatives by job. But when the deliverable is a picture of a page, handing the browser off is how the memory problem stops being your problem.
The takeaway
Puppeteer memory leaks in production are three problems wearing one trench coat: unclosed pages, an un-recycled browser, and zombie processes. Fix them with finally-block cleanup, disposable browser recycling, concurrency caps and bounding flags, and an init process that reaps orphans. Then measure RSS and process count, not just the Node heap, so you find the real source instead of guessing. And if screenshots are the whole job, the most durable fix is to not run Chromium at all.
FAQ
- Why does Puppeteer leak memory?
- Most Puppeteer memory growth in production is not one bug but three compounding ones. First, pages and browser contexts you open are never closed, so their renderer processes stay resident. Second, a single long-lived browser instance accumulates state across thousands of navigations (caches, listeners, detached DOM nodes inside the page) that Chromium never fully releases. Third, crashed or timed-out captures leave orphaned zombie Chromium processes that the OS still counts against your container. The RSS you watch climb on your dashboard is usually the sum of leaked child processes, not a leak in your Node heap.
- How do I find a Puppeteer memory leak?
- Measure the right thing first. A Puppeteer leak shows up as the container's resident set size (RSS) growing over hours until it gets OOM-killed, and most of that memory lives in Chromium child processes, not the Node heap. Watch process count and total RSS, not just process.memoryUsage(). Then take two heap snapshots of a single browser context an hour apart under steady load and diff them for detached DOM nodes and retained listeners. Confirm that page.close() and browser.close() actually run in a finally block on every path, including timeouts and thrown errors.
- How do I limit Puppeteer memory usage?
- Close every page and context in a finally block, recycle the browser after a fixed number of jobs (treat Chromium as disposable), and cap concurrency so you never run more parallel captures than the container has RAM for. Launch with flags like --disable-dev-shm-usage (so Chromium uses /tmp instead of the small default /dev/shm) and a memory ceiling via --js-flags="--max-old-space-size=512". None of these fix a leak; they bound the blast radius so one bad page cannot take the box down.
- Should I use one Puppeteer browser or a new one per request?
- Neither extreme is right. One shared browser for the life of the process leaks slowly as state piles up across navigations. A brand-new browser per request is safe but pays a cold-start cost of hundreds of milliseconds to a second on every capture. The pattern most teams settle on is a pooled browser that is recycled after N jobs or M minutes: you reuse it enough to amortize startup, then throw it away before the leak matters. Treating Chromium as disposable is the reliability win, not a specific flag.
- How do I kill zombie Chromium processes from Puppeteer?
- Zombie Chromium processes come from browsers or pages that were never closed because the parent path threw or timed out. Always call browser.close() (and page.close()) in a finally block, and set an overall timeout that force-kills the browser process if a capture hangs. On Linux, run Puppeteer under an init process (Docker's --init, or dumb-init/tini) so orphaned children get reaped instead of accumulating. Periodically log ps for chrome processes so you can see leaks before OOM does.
- Is it worth self-hosting Puppeteer just for screenshots?
- If screenshots of URLs are the only reason you run Chromium, the memory-leak, zombie-process, and cold-start work is pure overhead for a job a hosted API does in one HTTP request. Self-hosting Puppeteer makes sense when you also click, type, scrape, or run full end-to-end tests and need direct browser control. When the deliverable is just an image of a page, a hosted screenshot API removes the browser fleet, and with it the 3am pager for memory. Reach for the library when you need to drive the browser, not when you need a picture of it.
Capture any website with one API call
Get a free test key and wire your first request in two minutes.
Written by
Grabbit Team
Screenshots as a service
The team behind Grabbit, the screenshot API for developers and AI agents. We write about web capture, rendering, and automating screenshots at scale.
Keep reading
Puppeteer Alternatives in 2026: What to Use Instead (by Job)
An honest guide to Puppeteer alternatives in 2026, matched to the job: Playwright for automation, Selenium for cross-language, Cypress for app tests, and a hosted API when all you need is a screenshot of a URL.
Jul 15, 2026 · 6 min read
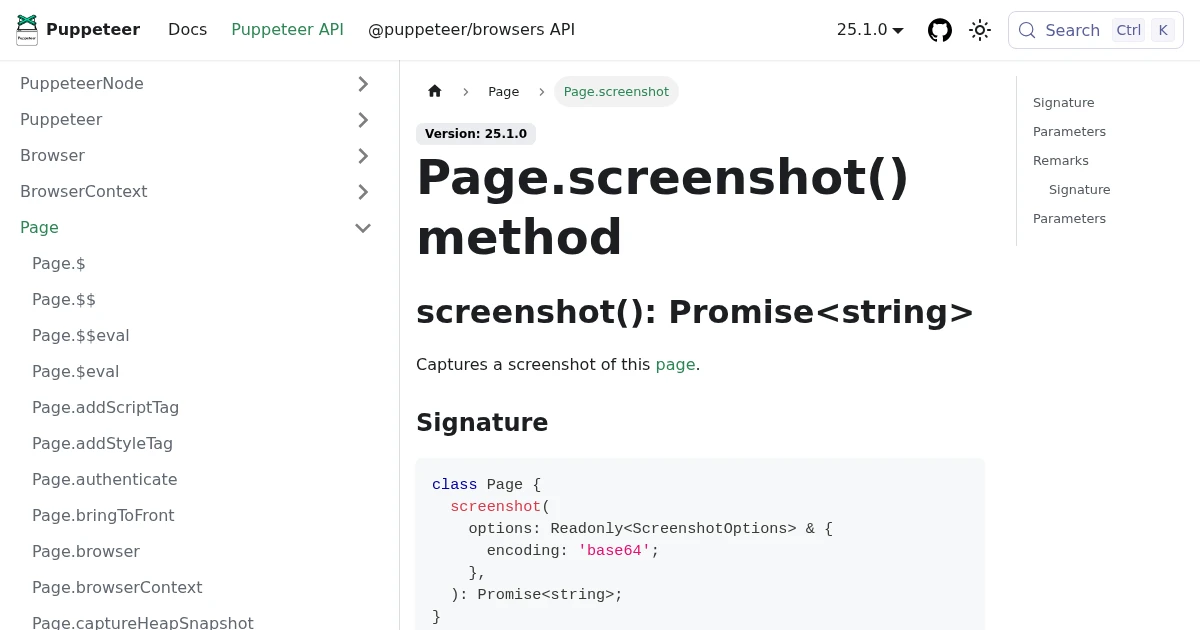
How to Take a Website Screenshot in Node.js (4 Ways)
Four ways to screenshot a website in Node.js: Puppeteer, Playwright, the capture-website wrapper, and a hosted API. Working code, the trade-offs, and when to skip running Chromium.
Jun 18, 2026 · 4 min read
Screenshots for AI Agents: Giving Your LLM Eyes on the Web
Multimodal LLMs can reason about images, but they need a way to see web pages. A screenshot API is the one-line bridge that turns any URL into a hosted image your agent can analyze.
Jun 18, 2026 · 5 min read